

In our latest initiative, we delve into the integration of geospatial visualization and artificial intelligence (AI) to enhance community decision-making processes. Specifically, our project employs AI to simulate a dataset containing demographic details, aimed at identifying the most suitable site for a new youth art center in Seattle. Utilizing Cesium ion, alongside supplementary tools, we brought this innovative concept to fruition.
Our Workflow:
- Geographical Segmentation: We commenced by leveraging ChatGPT to partition the Seattle region into distinct neighborhoods. Employing the Code Interpreter extension, we generated a fictitious dataset that included geographical boundaries, general population demographics, the proportion of teenagers, and average household income.
- Neighborhood Indexing: The AI was then tasked with creating an index to prioritize neighborhoods based on their need for a community center. The resulting data was compiled into a JSON file for further processing.
- Data Visualization: To facilitate the visualization of this data, we converted the JSON file using Geojson.io, which allowed us to overlay color-coded layers indicative of the AI-calculated index.
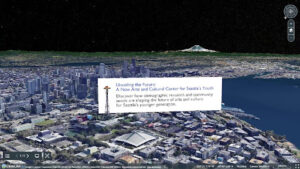
- Interactive Geo Mapping: Through Cesium ion, users can interactively click on different neighborhoods within the 3D map to determine which areas would most benefit from a new community center. We augmented the map with a 3D model of a potential building, created with Blender, and included an animation that previews the construction process.
- Interior Pre-visualization: To assist stakeholders in envisioning the completed project, we used Midjourney to generate hypothetical interior designs of the proposed community complex.
Our project underscores the transformative impact of geospatial visualization and AI on community planning. The ability of tools like Cesium ion to translate complex data into an interactive, visual format represents a significant advancement in business storytelling, enabling stakeholders to engage with and understand data more effectively.
Credit: Maria Sanchez Isaza | Paolo Tosolini Productions
In collaboration with the NW EDU Network
Last Updated April 29, 2024