
What are Bellevue College’s goals?
Our Greenhouse Gas Emissions Audit tracks the emissions associated with our school operations and activities, and provides a data-based snapshot of progress towards our carbon emissions and carbon neutrality goals. Updated annually.
Bellevue College’s greenhouse gas emissions goals through the Second Nature Carbon Commitment are as follows:
- To reduce GHG emissions below the 2010 baseline:
- 5% by 2015
- 20% by 2020
- 60% by 2030
- To achieve carbon neutrality by 2050
Data Collection
Until FY 2016-2017, the Bellevue College Environmental Advisory Committee (now called the Sustainability Leadership Consortium) used the Clean Air Cool Planet Campus Carbon Calculator to conduct an internal Greenhouse Gas Emissions Audit, also known as a Carbon Audit. The Carbon Audit Report is an internal audit and inventory of greenhouse gas emissions attributed to Bellevue College campuses.
Now, the Bellevue College Office of Sustainability undertakes the audit. Since the Clean Air Cool Planet Campus Carbon Calculator was discontinued, we use the Sustainability Indicator Management & Analysis Platform (SIMAP). SIMAP® is a carbon and nitrogen-accounting platform that can track, analyze, and improve campus-wide sustainability. This has been used for our reporting since FY 2016-2017.
Since both the Clean Air Cool Campus Calculator and SIMAP require a lot of manual data entry and data collection from various stakeholders on campus, and the fact that this data has been gathered by a variety of people since 2010, we take this data and the results with a grain of salt. There are clear reporting errors in FY 2013-2014, which is why the results show a significant decrease in our campus GHG emissions, which is just not the reality. When viewing the graphs or looking at the summaries, please keep in mind that this is just a snapshot in time and that we have done our best to show our GHG story with the data available to us, using the best methodology available to us.
What data is reflected in our GHG Report?
Scope 1 – All Direct Emissions from the college’s activities under our control. This includes on-site fuel use, fleet vehicles, and refrigerant use.
Scope 2 – Indirect Emissions from electricity purchased and used by the college. Emissions are created during the production of the energy and eventually used by the organisation.
Scope 3 – All Other Indirect Emissions from activities of the college, occuring from sources that we do not directly own or control. These are usually the greatest share of the carbon footprint, covering emissions associated with travel to and from campus by students, faculty, and staff, business travel, procurement, waste, and water.
At this time, we have not included any emissions associated with the lifecycle and transportation of products used on campus such as paper and food. This would add to our scope 3 emissions.

Source: GHG Protocol
Results
To view our publicly available GHG graphs, please visit the Second Nature Dashboard.
This dashboard allows you to view our net and gross GHG emissions, as well as normalize GHG data against full-time enrollment or campus square footage.
FY 2018-2019 Summary
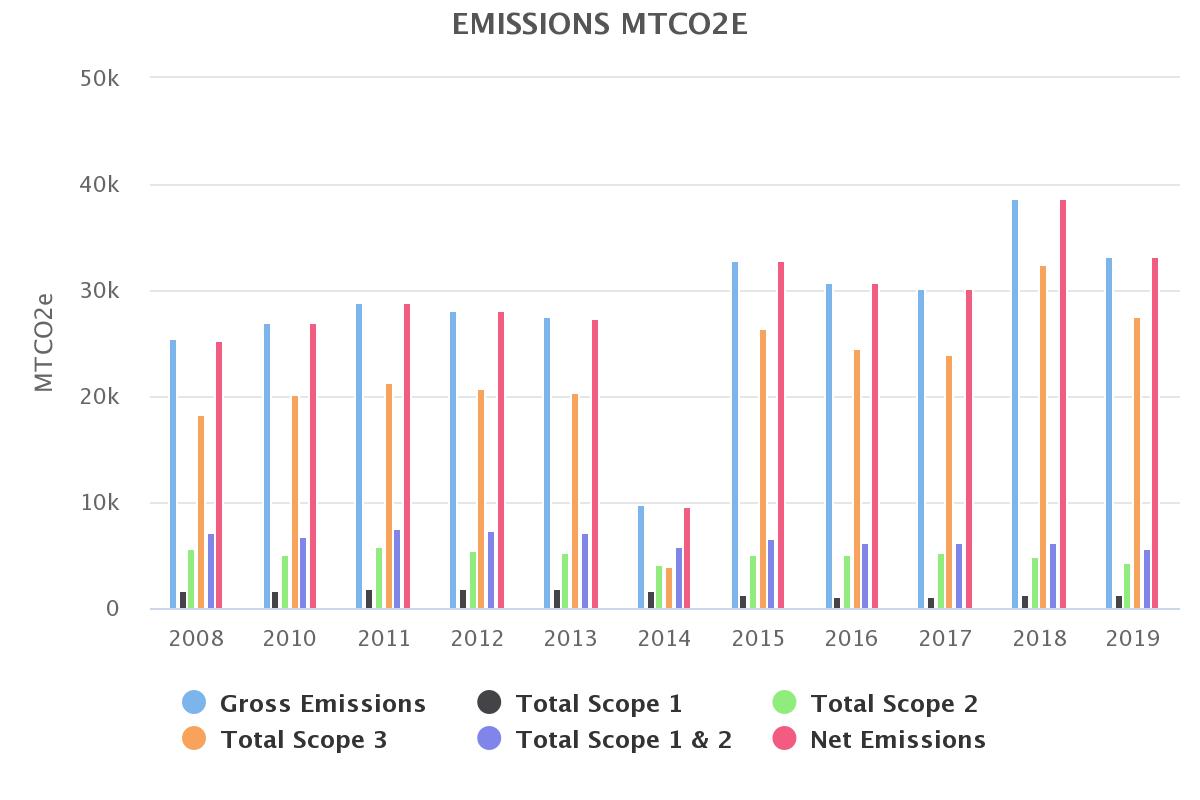
** There are major reporting errors in FY 2013-2014.
Previous Summaries
Some of the summaries compiled in previous years can be found below, which provide explanations about our GHG audit for that year.
2006-2008 Carbon Emissions Audit Report
2009-2010 Carbon Emissions Audit Report Update