Digital Humanities (DH) is a diverse field that brings together the humanities and digital practices, technologies, and resources. DH has pushed the intellectual possibilities of academic disciplines and offered new ways of reimagining and enriching teaching and learning across academic institutions. By utilizing DH methods and practices in the classroom, instructors support students in broadening their understanding of the applications of digital technologies and strengthening their critical thinking, analytical, and collaborative skills.
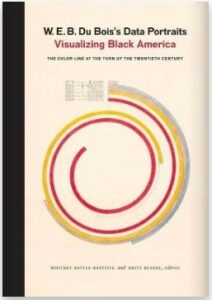
This workshop will provide instructors with the preparation they need to begin incorporating DH pedagogical approaches and methods into their classes. We will explore the historical and sociological basis of DH and one of its methods, data visualization, by reviewing W.E.B DuBois’s Data Portraits. This edited volume examines the data portraits of sociologist, writer, and activist W. E. B DuBois. At the Paris Exposition in 1900, the colorful and pioneering data portraits demonstrated visualization’s potential in educating broad audiences about social issues pertaining to Black Americans’ lives. Today, data visualization is a critical method in the field of DH as well as in a variety of academic disciplines, but most importantly data visualization is increasingly a method of public communication used in business, news, and political contexts. Focusing on W. E. B DuBois Data Portraits as a point of departure, this workshop series will provide faculty with a critical historical and contemporary foundation on this DH method.
By engaging with this text, participating in weekly book discussions, and completing learning activities, participants will be able to:
- Describe what digital humanities and data visualization are
- Explain the impact of digital humanities methods such as data visualization
- Examine digital humanities tools and projects involving data and data visualization
- Reflect on how learning about digital humanities or data visualization can shape pedagogy or foster students’ cultural awareness
Hybrid Course: Synchronous Zoom sessions with additional asynchronous work through Canvas
4 Fridays, 9:30-11 a.m., Oct. 6, 13, 20, 27 through Zoom
10 PD Hours – approx. 6 synchronous and 4 independent hours
$250 stipend for attending a minimum of 3 of the 4 sessions and completing a reflective assignment.
12 seats maximum: Register to save your seat!
Books are available to check out from the Faculty Commons.
Please reach out to Dellyssa Edinboro, Social Science, and 2023 DEFCon Fellow, for more information.
The discussion of DuBois’s Data Portraits greatly influenced how I approached including data visualizations in my classroom. I learned that data visualization is not merely tool for conveying information but also vehicle for evoking emotions and inspiring critical thinking.
Last Updated November 13, 2023
